An IoT system for construction worker safety
I hate using the phrase "Internet of Things", but I must admit that it has gotten a lot easier to do so, having used it so many times during, *sigh* The Internet of Things hackathon. During the hackathon, we were given different pieces of hardware, a collection of sensors and asked to build sometthing related to one of three themes: Transport, Health and Construction. We arrived at the hackathon, and realised that due to the preliminary selection process, there were a total of 10 teams. For six prizes. One for each category, and a 1st, 2nd and 3rd prize overall.
We decided to go with Construction. It had nothing to do with the fact that there was only one other team in the category (sometimes it doesn't hurt to play the odds). Thinking about the issues in construction, we were delighted to find that one of our members - Aaron - could find out first hand from his father about the primary pain points in construction. We wanted to make sure we found something that solved problems for both workers and contractors to improve the possibility for adoption.
§The Problem
We were surprised to learn that - despite implementing a number of stringent safety protocols at construction sites - Singapore has had a number of incidents, with a small but non-zero number of casualties. We wanted to improve worker safety, and at the same time provide an incentive to contractors to fork out the costs of implementing the system. We devised a two part system, each based on a similar array of sensors.
§Part 1 - Worker Safety
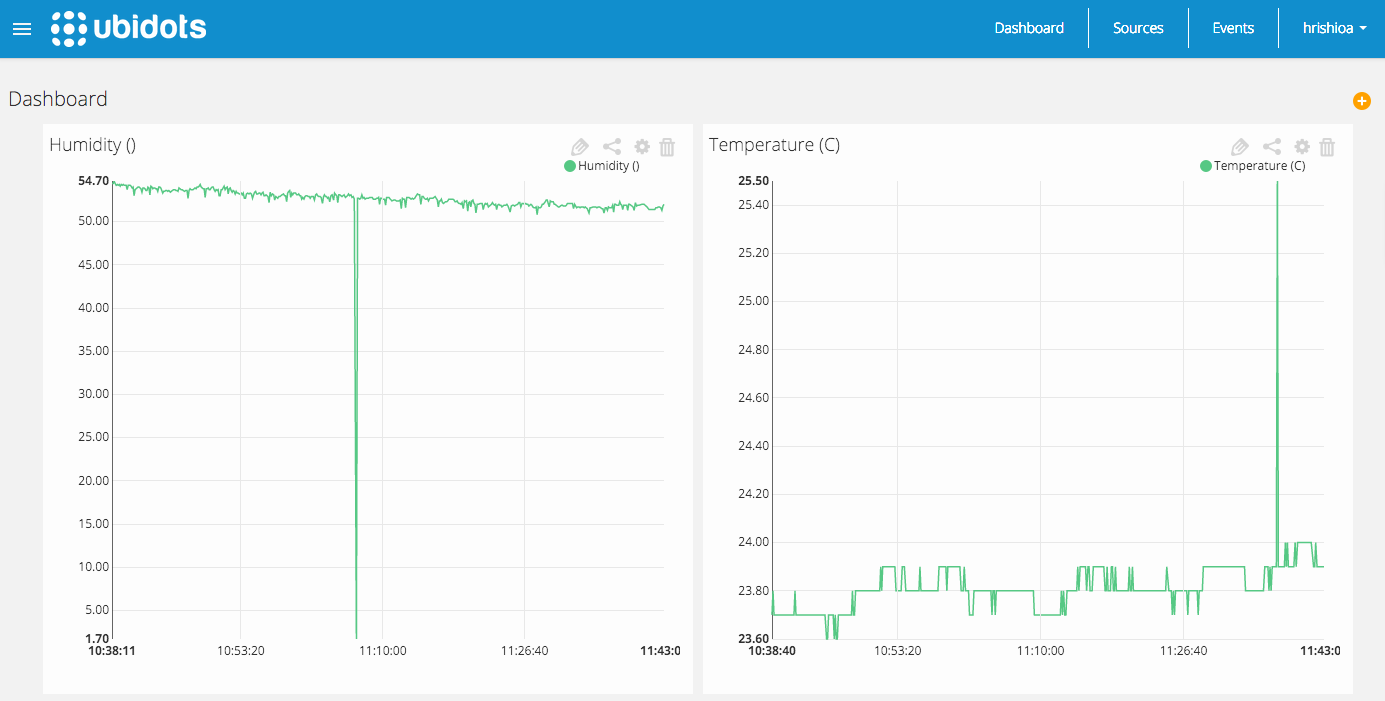
The system would use an accelerometer along with temperature and humidity sensors to monitor working conditions. The accelerometer would provide fall or impact detection, to provide quick response to accidents. The air quality sensor and temperature probe would monitor working conditions and provide a way for the ministry to assess the conditions of the workers directly. They could not be tampered with, and this provided for a better way to access the data compared to site inspections which we suspected the employers would prepare for.
§Part 2 - Workforce Redistribution
Using the accelerometer, we were able to compile an index of activity per worker that displayed how active a certain worker was during his day. Without providing the employers access to raw data, we dynamically detected active and idle parameters to provide an estimate of how over- (or under) worked the workforce was. The employer could use this information to redistribute his workforce to ensure optimum productivity. Such load balancing would also be beneficial to the workers and prevent understaffing in areas that required more workers.
Having completed the concept, we moved on to implementation.
§Implementation
The implementation process was fairly smooth, but from the outset we needed three basic elements to implement the functionality.
§Hardware
§Processor
We were provided the new development board from MediaTek Labs, the LinkIT One. Based on the Mediatek MT2502 SoC, the board provided Arduino-compatible ARM Development.
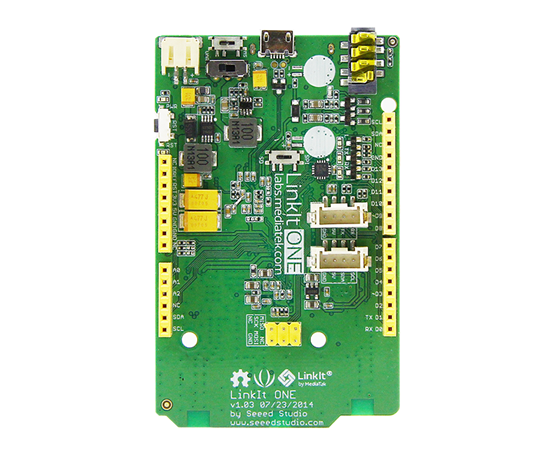
To their credit, the SDK was pretty simple to install on Windows and Mac. Despite our distaste for it, we resorted to using the Arduino IDE to save time. Using the IDE meant that we could not have an Operating System running concurrent tasks. This meant that the while data was being streamed to a server, the sensors could not be reliably operated. However, considering the scope of the prototype for the hackathon and the time constraint of 24 hours, this was considered an acceptable trade-off.
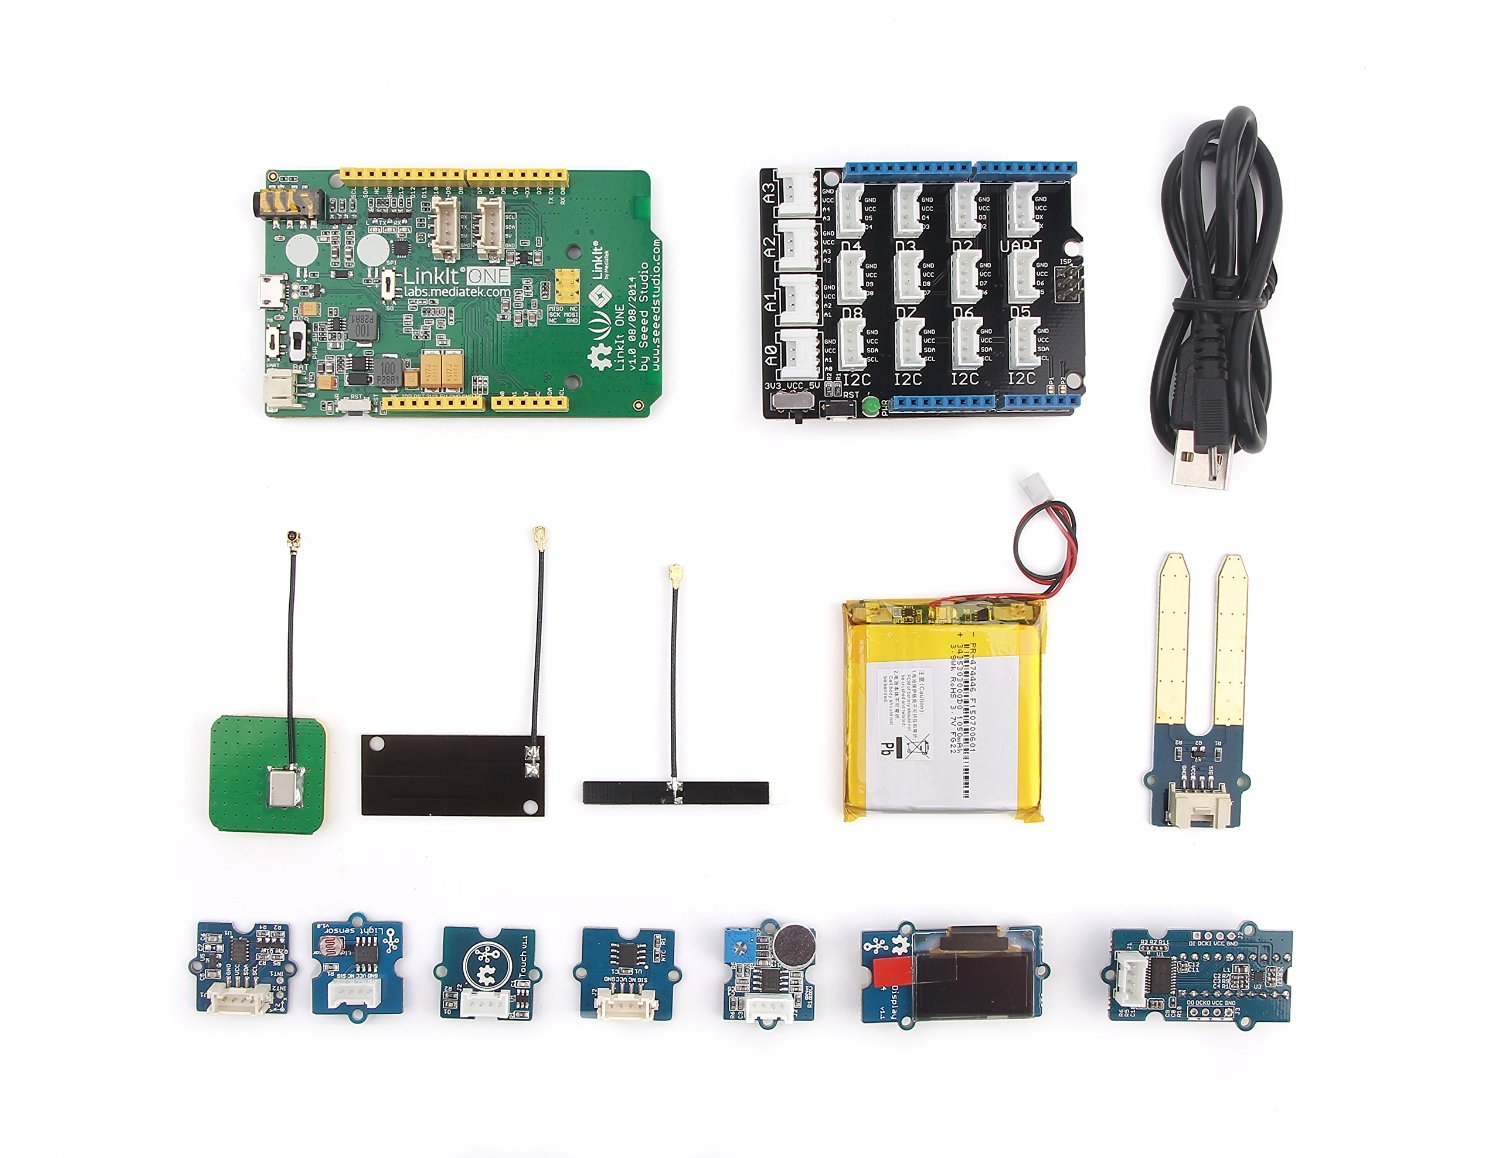
§Sensors
We made use of the sensor kit provided at the Hackathon for the LinkIT One. We were surprised to find that it contained all the sensors we required, and we appreciated the Li-ion battery and charger included.
§Web Frontend
For the purposes of demonstration, we decided to use Ubidot as our IoT streaming platform. The prototype would send POST requests to the service API with aggregated sensor data, and we could use any online dashboard to demonstrate the proof-of-concept. This simplified things on our end, meaning that we did not have to build a complete frontend from scratch anymore. The catch was that all aggregation and backend processing would have to be done on the client-side, which meant that we would lose more cycles on the LinkIT. Despite this, we felt that the time saved in building the UI more than made up for this loss.
Now that we had the infrastructure ready, we moved on to implementation.
§Software
The first task was to ensure that the Wifi-connectivity on the LinkIT functioned well enough for us to use it for streaming. From an overall evaluation of the system, we were quite sure that it was upto the task, but we wanted to make sure that it still performed reliably when operated from the bloated Arduino IDE while simulatenously pulling sensor data and peforming analytics.
//Wifi Request Variables
char action[] = "POST ";
char server[] = "things.ubidots.com";
char path[] = "/api/v1.6/variables/####################/values";
char token[] = "##########################";
int port = 80; // HTTP

LWiFiClient c;

//Send requests
//Build JSON
var = "{\"value\":"+String(avg_accel)+",\"Acceleration\":12.345,\"user\":\"toonistic@gmail.com\"}";

while (0 == c.connect(server, 80))
{
  Serial.println("Re-Connecting to WebSite");
  delay(500);
}

//....Print all relevant data to server using c

Serial.println("POST Posted: var = "+var);
Our JSON Builder was mostly our editor, but we didn't want to incur the memory penalty of adding a JSON Library to our Code.
Before we could test it, we needed to collect data from our sensors. This proved to be quite straightforward, and (after an hour of looking for valid libraries) we wrote some I2C code ourselves that managed this task. The complete code is at the link at the end of this post, and it's fairly long.
We then ran a few tests and found that the POST requests held up the system for as much as two seconds, and we implemented interrupt routines that simply averaged the data over this period of time. We reduced our resolution a great deal in doing this, but none of the data would be lost. Given time, we wanted to implement transient and noise reduction, but we decided to leave it for another day.
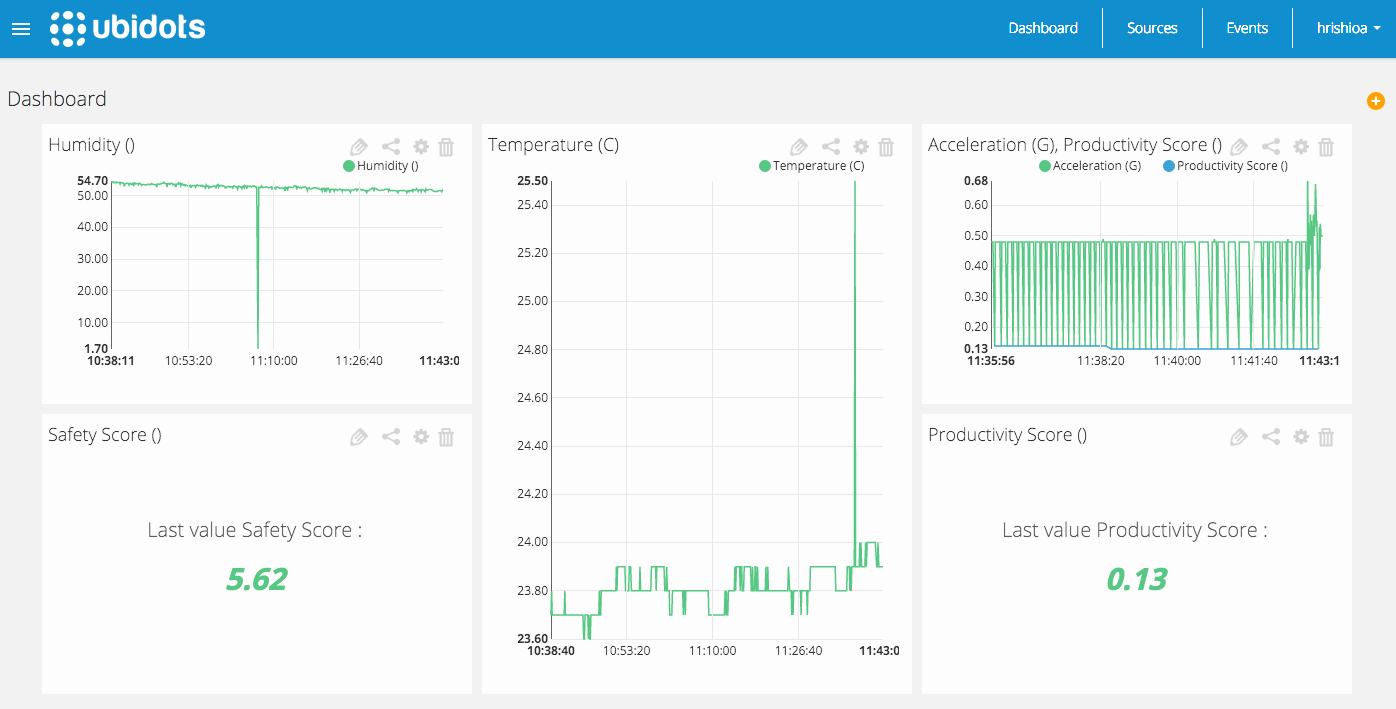
Now that we were successfully accessing sensor data and uploading it to our front-end, we needed to perform analytics that would hide raw data from the consumer and prevent exploitation. For this end we implemented two singular scores on each side. The first we called the Safety Score. In a number, it would provide an analysis of worker safety conditions. The closer you are to zero, the safer your conditions.
temp_var = ((temp_var*datapoints)+abs(temp-ideal_temp))/(datapoints+1);
humid_var += ((temp_var*datapoints)+abs(humid-ideal_humid))/(datapoints+1);
if(avg_accel > accel_thres)
  accel_var++;

safety_score = ((temp_var*0.001)+(humid_var*0.001)+(accel_var*0.1));
Temperatures and humidity beyond a pre-set threshold would increase the safety score, along with falls and incidents and anomalies in accelerometer data.
The second part, which we called the Productivity Score would aggregate accelerometer data, compare it against a dynamic threshold for activity, and update the system on the percentage of activity in a certain day. If you worked for six hours total in a span of eight hours, your score would be 0.75.
avg_accel = (abs(Axyz[0])+abs(Axyz[1])+abs(Axyz[2]))/3;

if(avg_accel>max_accel)
  max_accel=avg_accel;
if(avg_accel<min_accel)
  min_accel=avg_accel;

if(avg_accel>((max_accel+min_accel)/2))
  points_above++;
else
  points_below++;
Not the most elegant solution, but in hackathons we've found often that done is better than perfect.
Combining the two and broadcasting to the front-end, we now had a system that would intimate the ministry about worker safety, and the employer about stress points in his workforce.
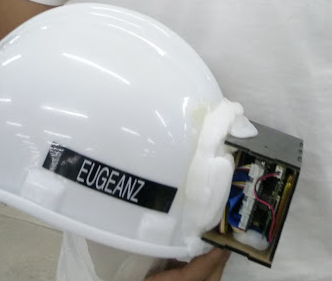
It took us an hour to build a casing out of acrylic, add an LED Bar for some visual indication, and use soft plastic to attach it to a hard-hat.
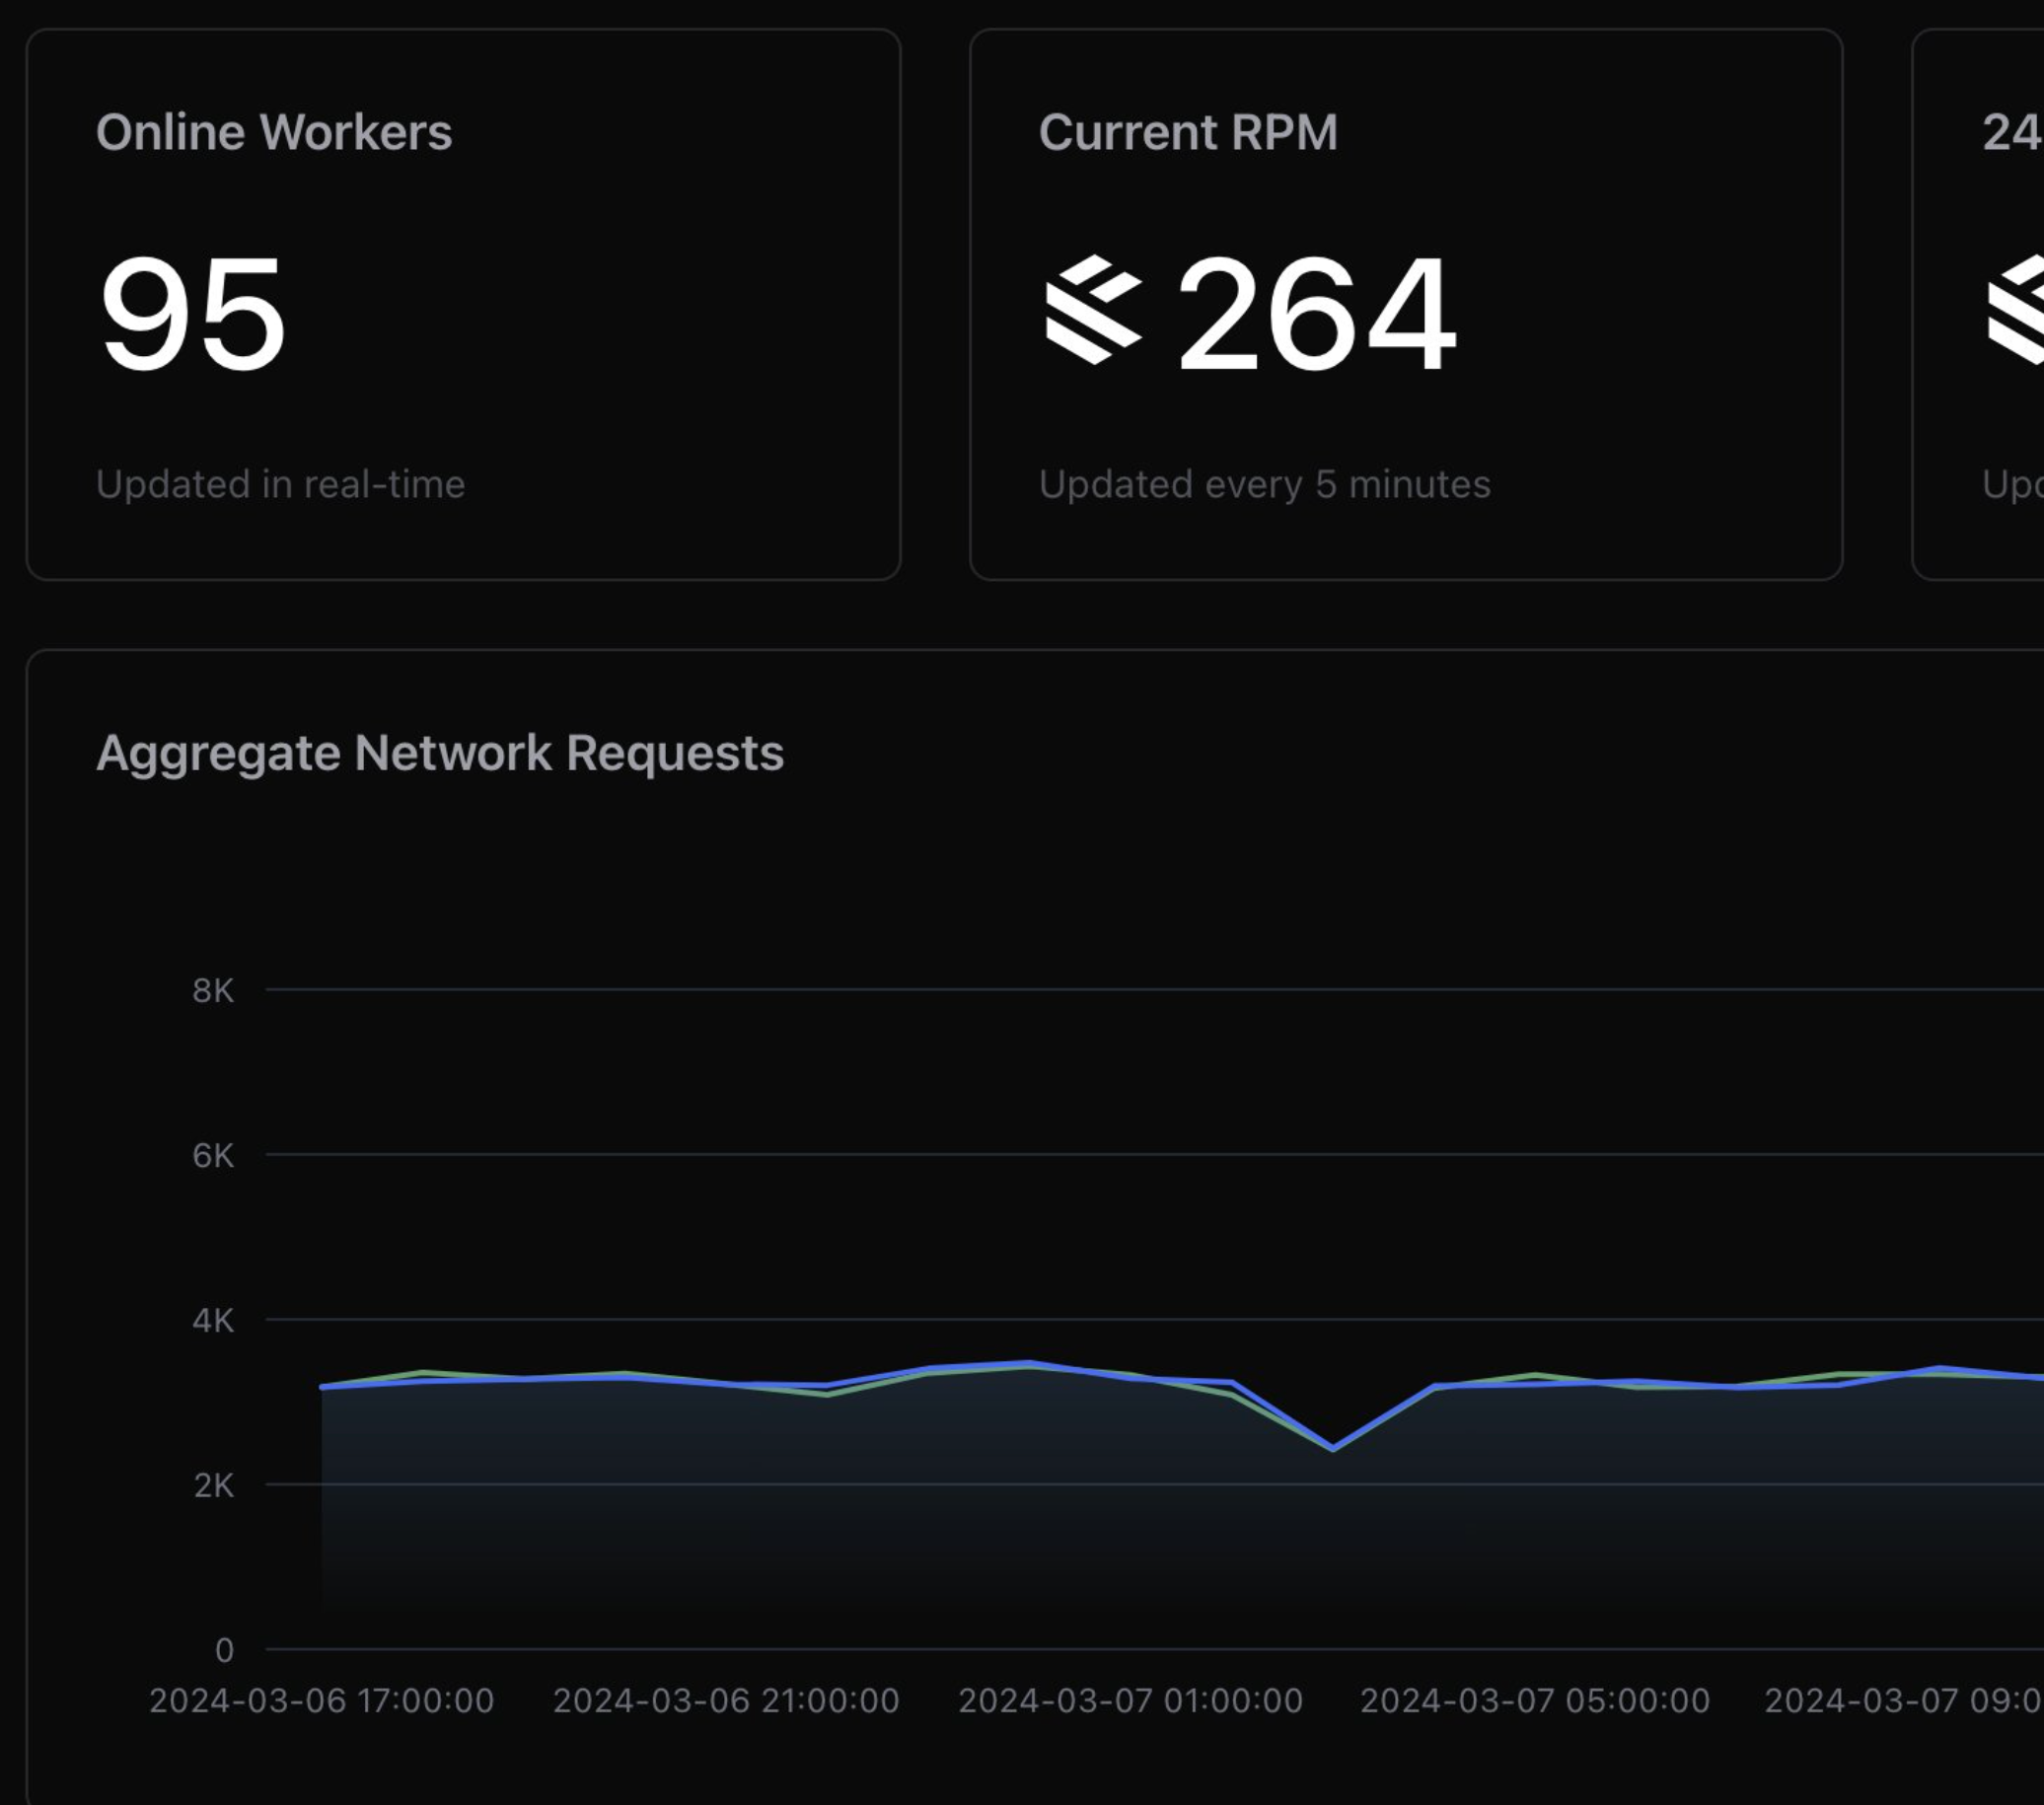
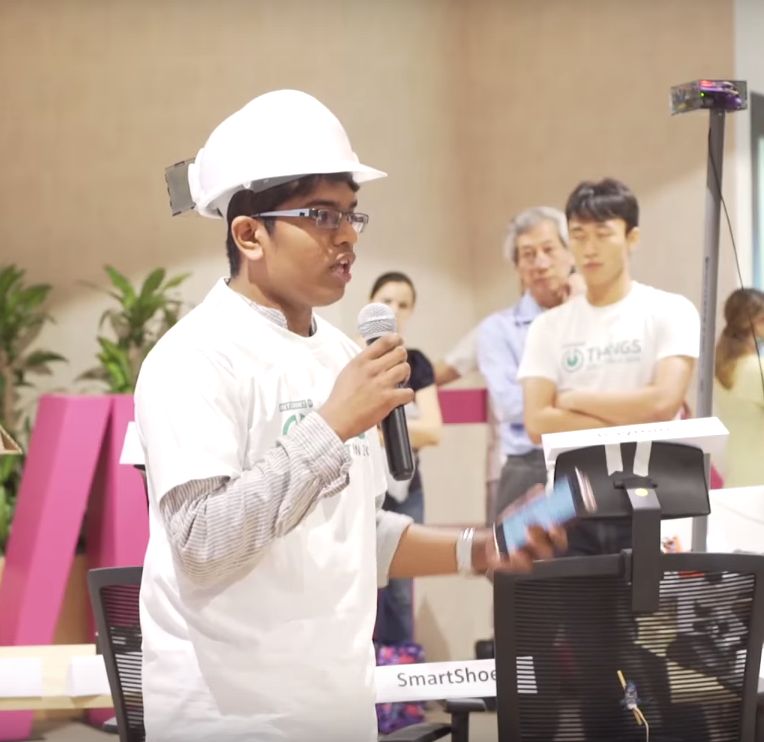
The Front-end functioned admirably, providing a decent feed of live data. I pitched while wearing the product, and the audience could either listen to me or watch the live feed of easy-to-understand information on the projector.
The information displayed would be very intuitive to understand, but we added a stream of the other sensors just to demonstrate that the feed was indeed live.
We received some offers of funding at the end of the pitch - in addition to winning best product - but we decided to make our source public and pick up the project sometime later in the future.
The code for this project can be found here.
It was an amazing weekend with a lot of beer, and it helped me remember why I spend so many of my weekends at hackathons, losing sleep when I should be catching up on it.

Not a newsletter